
There is a certain standard formula to try get profit: SMA 30 INDICATOR COMBINED WITH RESISTANCE/SUPPORT. It is based on two important and reliable factors: trends and levels. A key role in this strategy is played by simple moving averages (SMA 30 indicator). In order to have a good step, you need to familiarize yourself with the main strategies.
Strategy Using SMA 30+ Resistance/Support
If you do not know these 2 indicators, you can review these two articles:
- What is SMA indicator?
- What is Resistance/Support?
Regarding this strategy, these two indicators and the SMA 30 are to determine the trend of the price. The levels (Support/Resistance) will be the signal for entry points.
Basic Settings For SMA 30 Trading Strategy
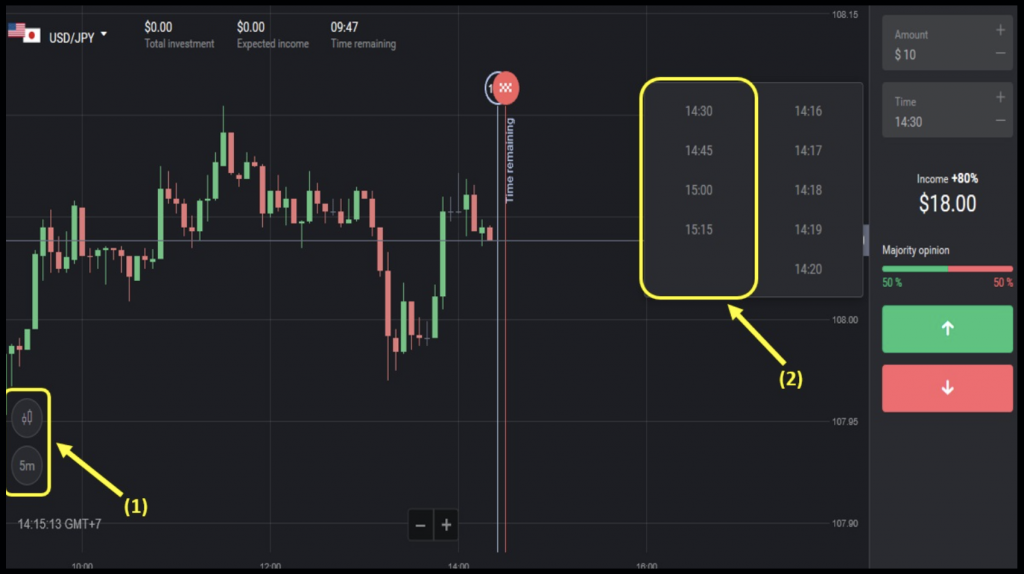
1-Familiar asset pairs: USD/JPY, EUR/USD, USD/CAD.
2-A 5-minute Japanese candlestick chart
3-.The expiration time of 15 minutes or above.
4-Setting up the SMA 30 indicator and identifying the levels of the price.
Formula For Opening Orders Using The SMA 30
After setting up the SMA 30 indicator, use it to determine the trend
of the price. You need to remember repeat a little basic knowledge.
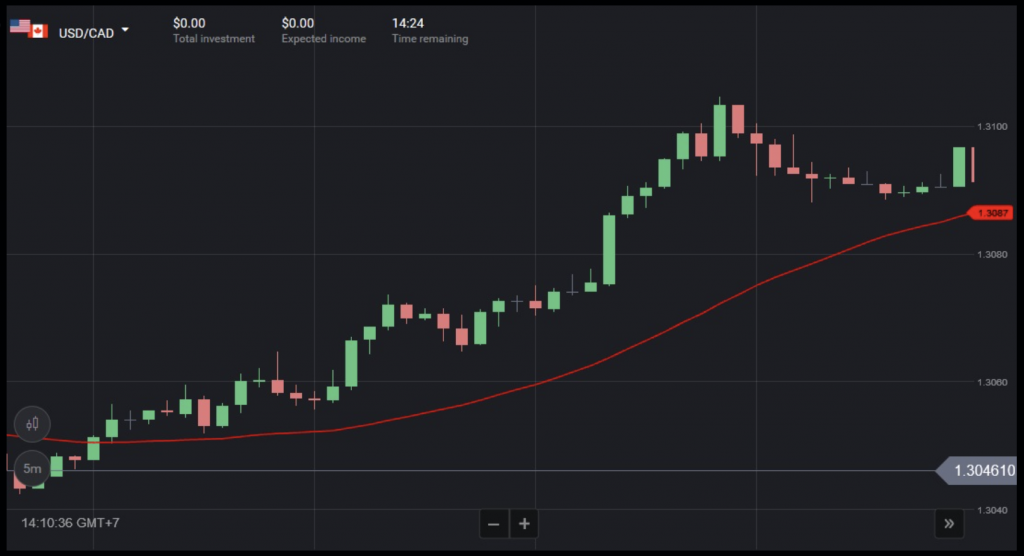
Prices in an uptrend:
Candlesticks are above the SMA 30 and the SMA points up.
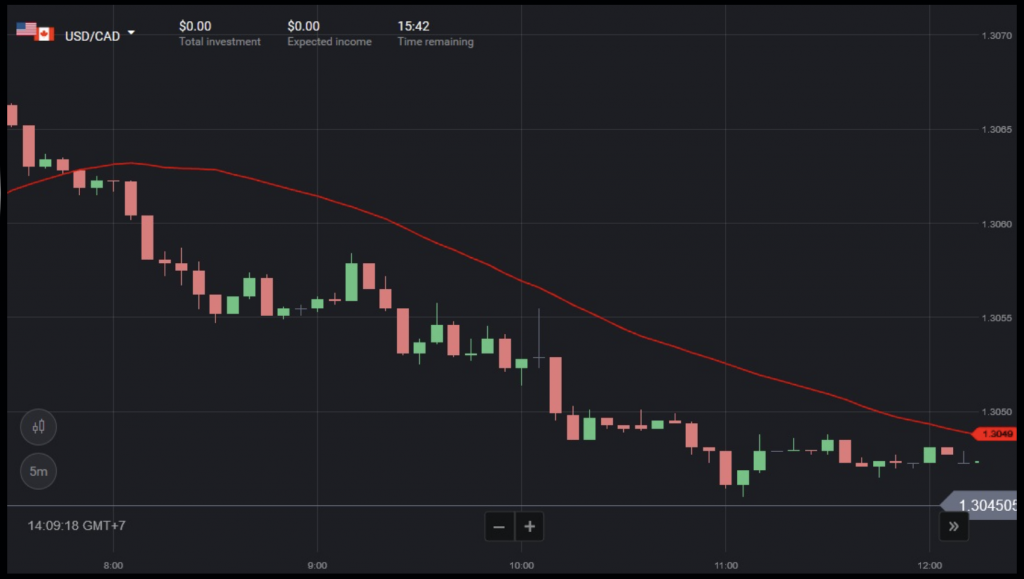
Prices in a downtrend: Candlesticks are below the SMA 30 and the SMA heads down.
Prices in sideways: The indicator goes sideways and keeps crossing candlesticks.
In this strategy, you can only open orders when the price goes uptrend or downtrend only.
Formula for opening orders:
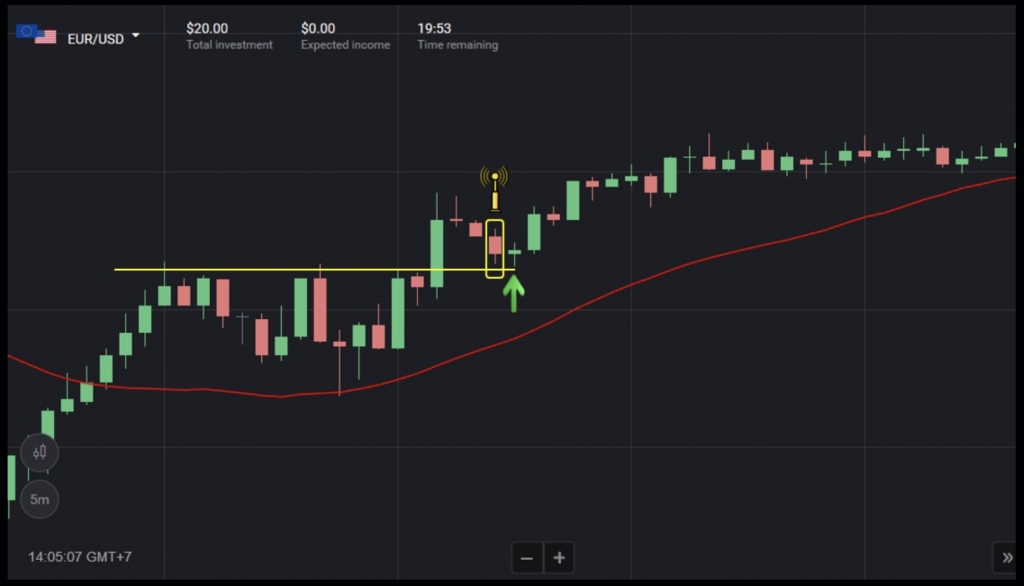
Open an UP order = uptrend + the price touches the support (which is the broken resistance).
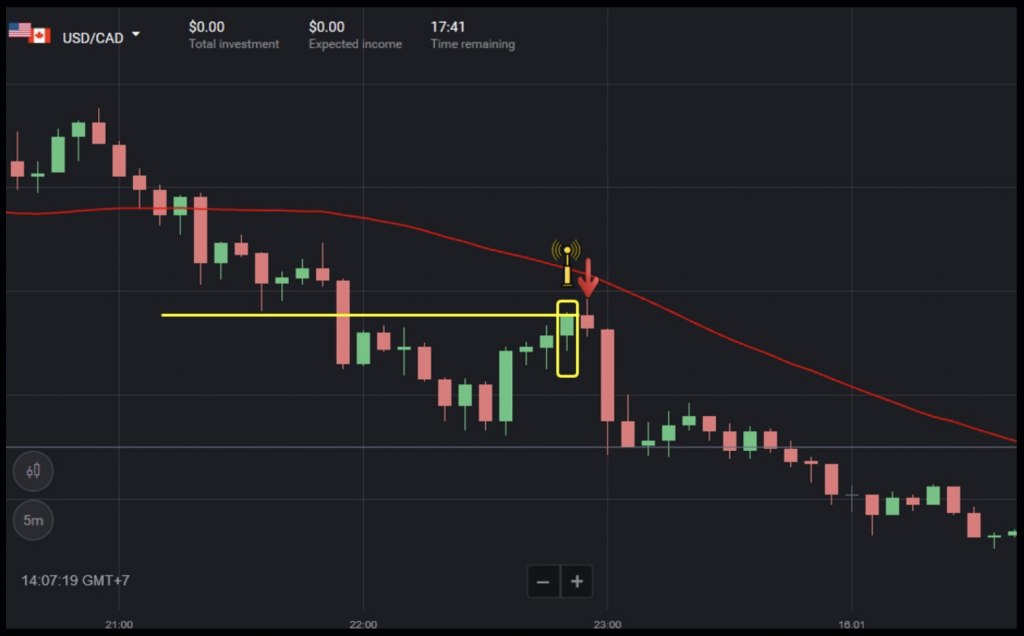
Open a DOWN order = downtrend + the price touches the resistance (which is the broken support).
Capital Management Method
Since this is a trendy trading strategy, the closer to the end of the trend is, the more likely the levels are broken or the trend is over. The most reasonable capital management method for this strategy is gradually reducing investment for later orders.
Use the profit of the previous order as the investment amount for the next order. If you lose 1 order, better for you to stop trading and turn off your computer.

This method helps you manage your capital, and you can minimize the possibility of burning out your account and protect your profits.
Important Things About This Strategy
When prices test the levels and a reversal candlestick pattern appears, you can completely ignore it.
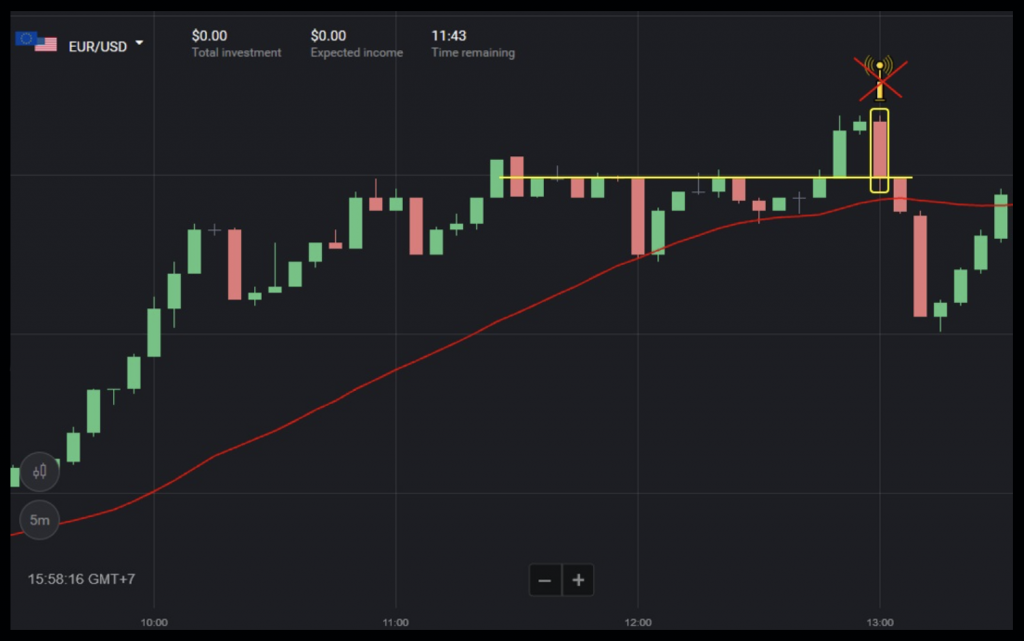
As the example above, the price tests the support with a bearish reversal candlestick pattern (Evening Star). Then the price breaks out of the level and ends that trend.
If the price tests the levels with special candlestick patterns (Pin Bar, Pull Back, etc.), the rate will be higher.
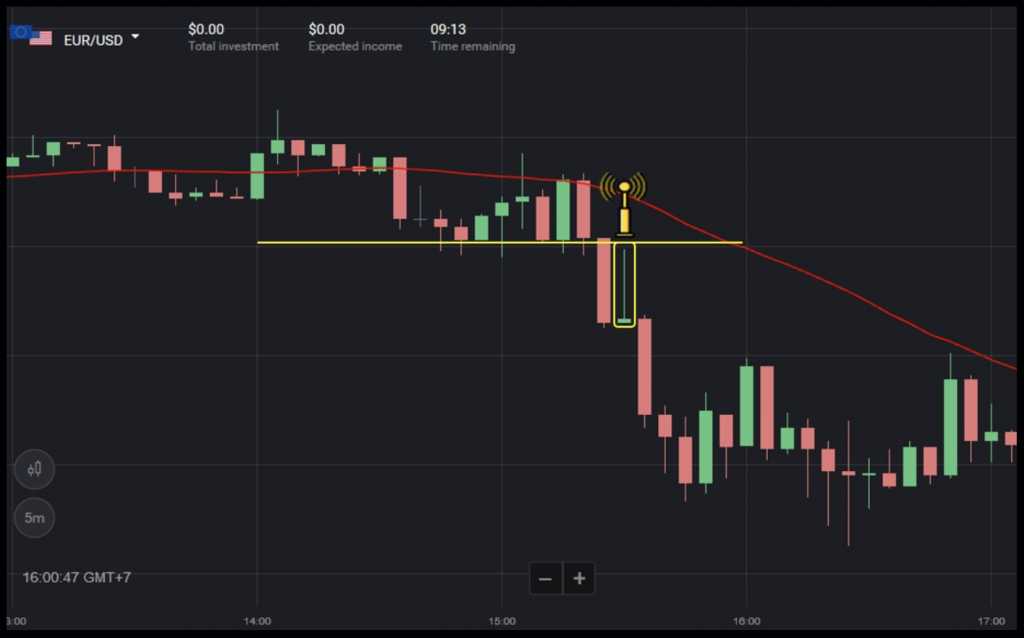
Do not open orders when the price is not completely in a trend.
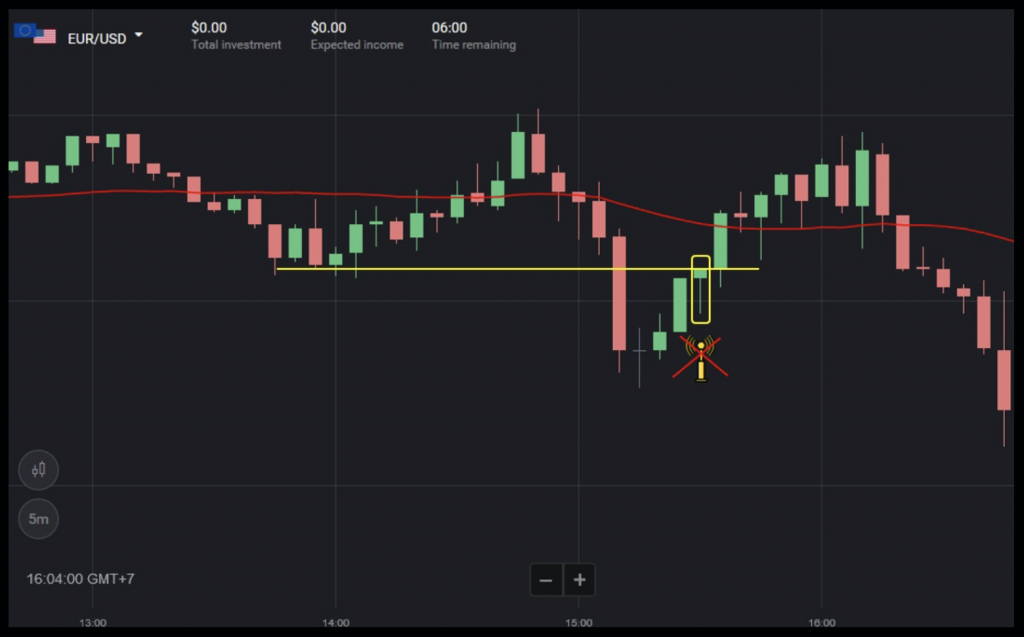
Things to note about this strategy.
In the example above, the price only tests the level once after breaking. This cannot confirm that the price has entered a trend.
Some Opened Orders Using SMA 30 + Support/Resistance Strategy
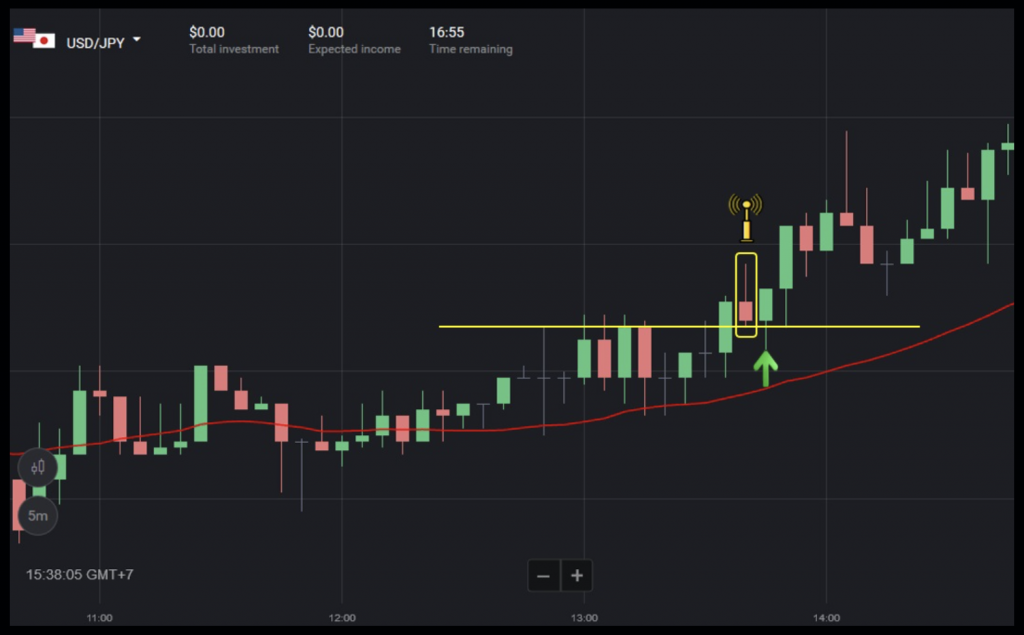
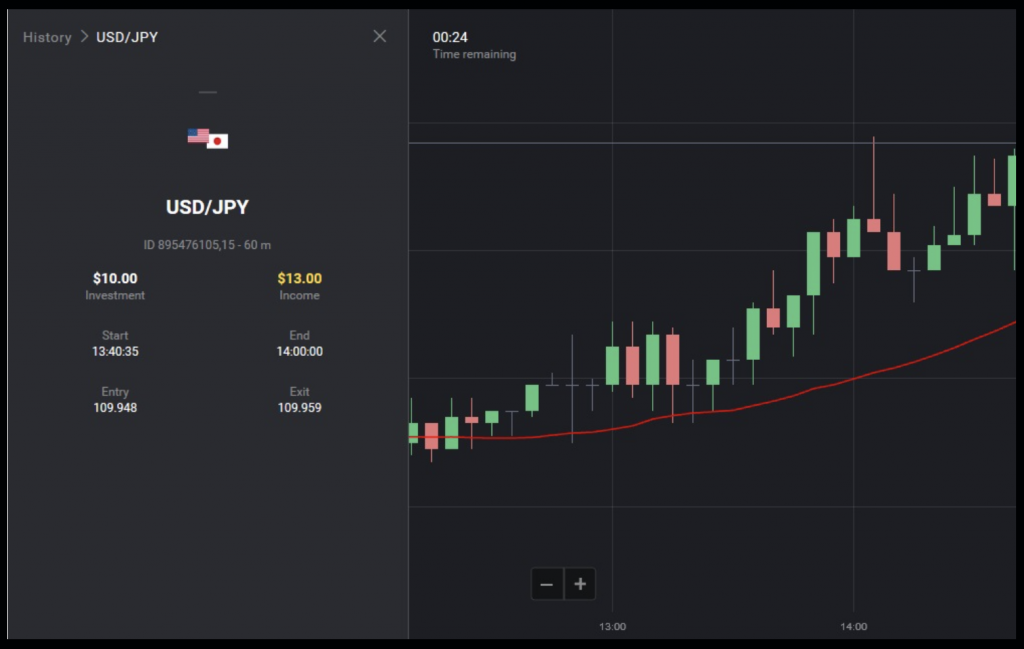
1st order: The assets of USD/JPY The price broke out of the resistance, creating an uptrend. It then rebounded to test the level with a bearish candle => opened a 20-minute UP order.
Result of trade:
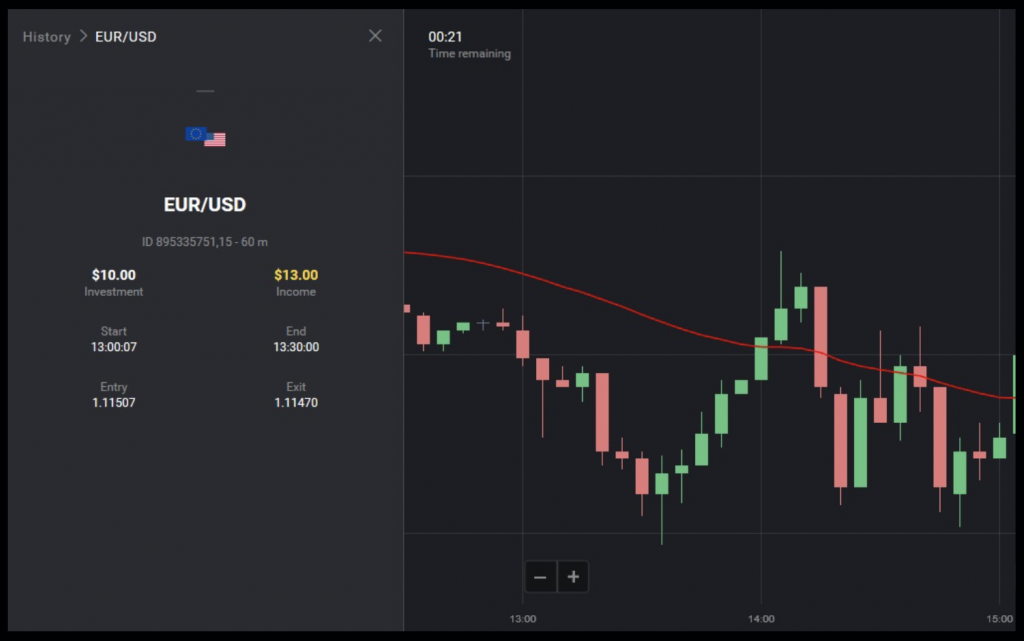
2nd order: The assets of EUR/USD. The price was in a downtrend. It then tested the level (the old support) with a Pin Bar candlestick. This was a very good signal that the price would plummet => opened a 30-minute DOWN order.

Result of trade:
You can try this strategy on a demo account. Do not forget to leave any comments and questions in the comment section.