

The Awesome Oscillator (AO) indicator is a common indicator among deals traders, therefore, this formula will give you very good signals to predict the price trend when entering a trade.
Awesome Oscillator Indicator
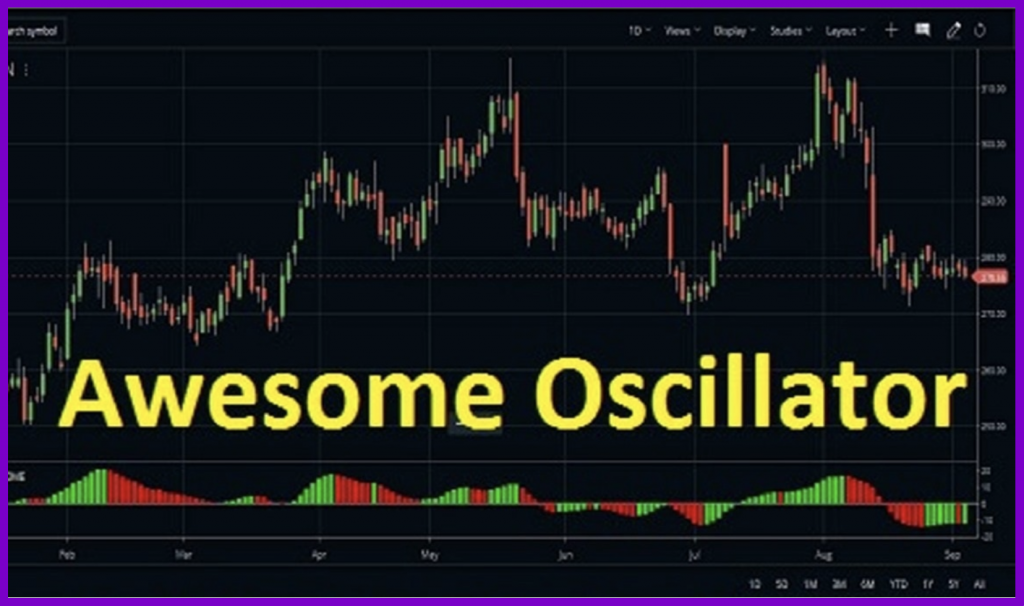
It is a technical indicator in the form of a histogram used to measure market momentum. The AO is basically based on simple moving averages of the data series, with different defined shifts.
Specifically, the AO is calculated as follows:
The AO is the difference of the simple moving averages in 5 consecutive periods and the simple moving averages in 34 periods.
Thanks to this indicator we can predict the direction of prices in the short and medium-term.
Signals That The Ao Indicator Brings You
Basic Bullish/Bearish Signal
Any traders can use the Awesome Oscillator because this is the simple signal.
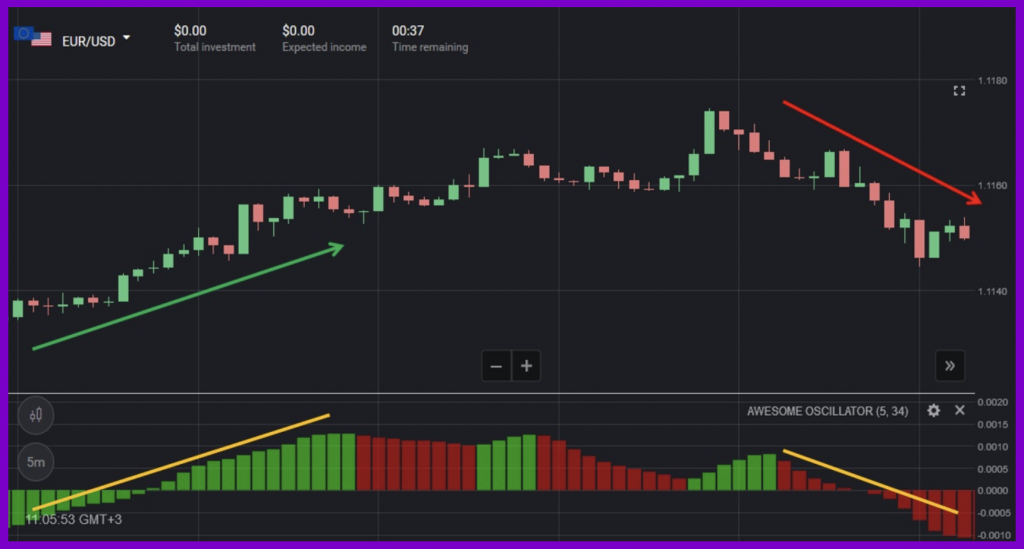
This is when the AO line crosses the Zero line.
For example, the price is in a downtrend when the AO line crosses the Zero line from top to bottom,. And vice versa, when the AO line crosses the Zero line from the bottom to top, we can see that the price stays in an uptrend.
The Divergence Signal Between The Price And AO
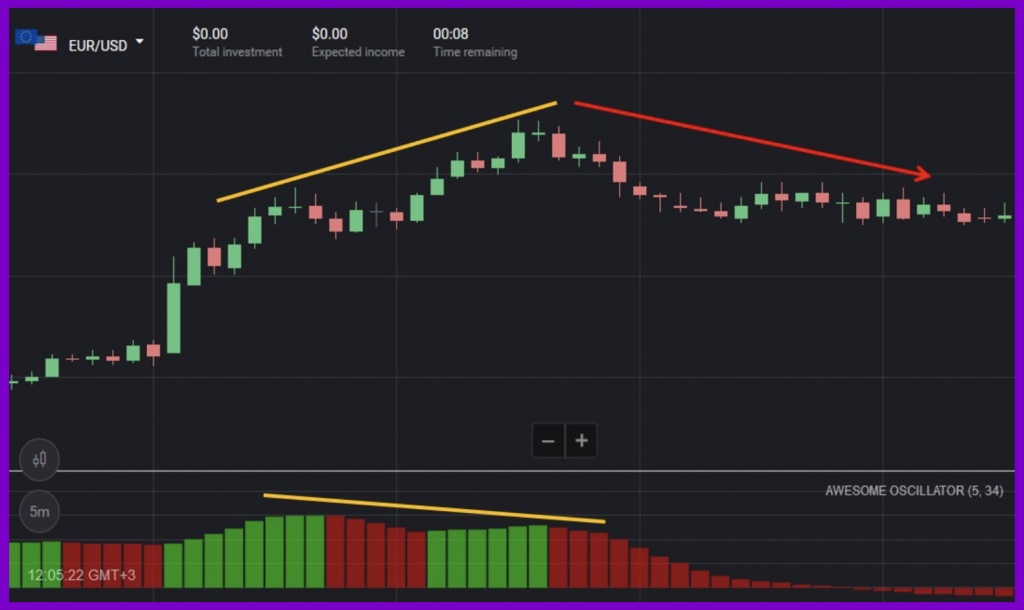
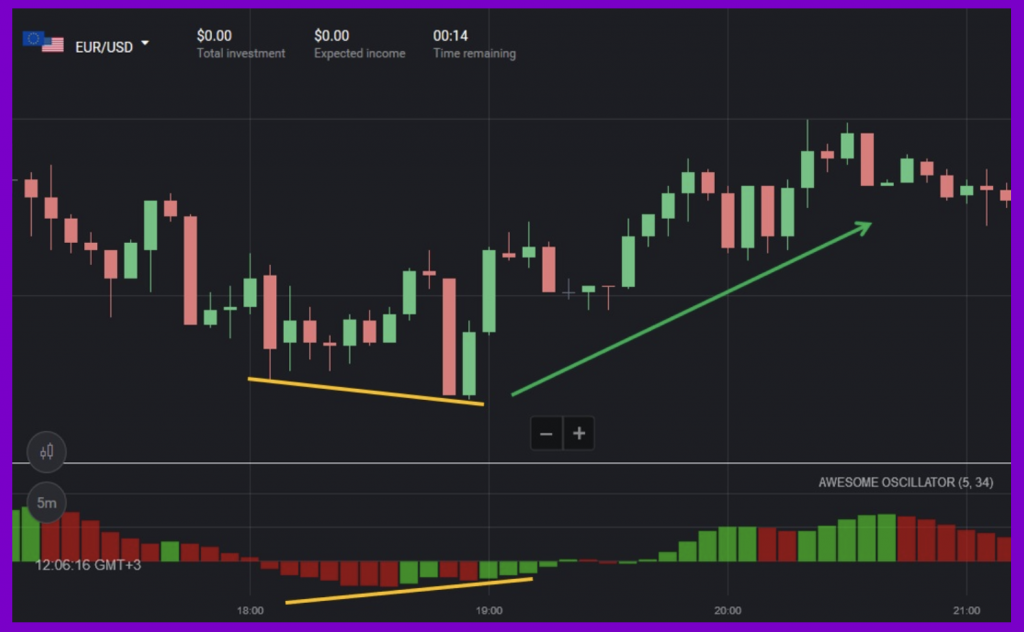
This is the signal when the AO reacts against the price.
AO bearish divergence compared with the price when the price is up but the AO tends to signal a bearish trend. After this signal ends, the price goes in a bearish trend in the future.
When the price is down, but the AO signals a bullish trend. This is called an AO bullish divergence compared with the price. After this signal, there will be a bullish trend in the future.
Saucer Signal
This is a signal for the continuation of a trend.
For example, when the Awesome Oscillator is above the Zero line (positive values), and after the two consecutive red bars is a green bar, then this saucer signal is considered optimistic. The market will continue the uptrend when the AO goes up.
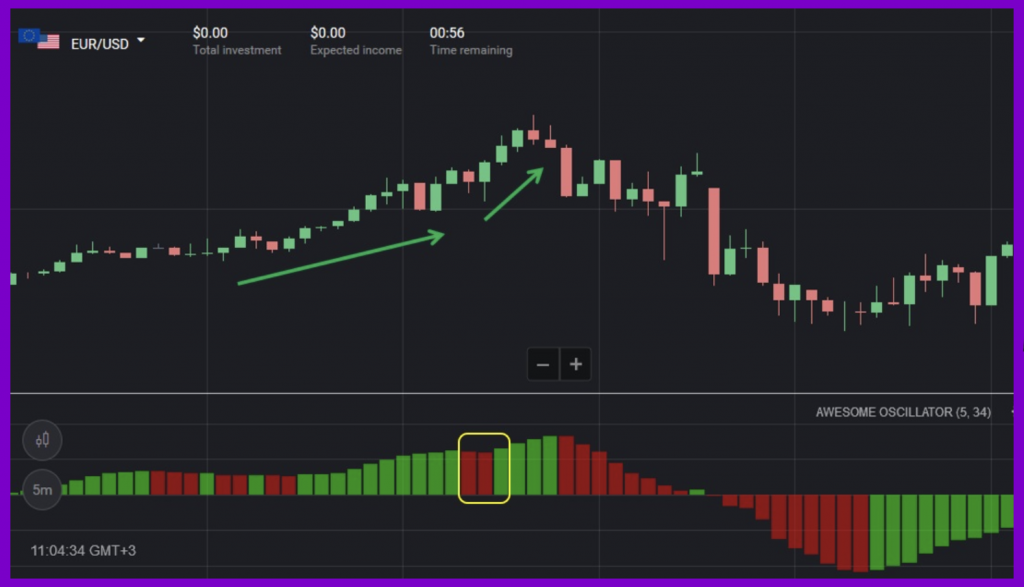
Similarly, when the market is in a downtrend and after two consecutive green bars is a red bar, this saucer signal is considered pessimistic. The AO goes down, indicating that the market will continue the downtrend.
How To Set Up Awesome Oscillator In Binomo
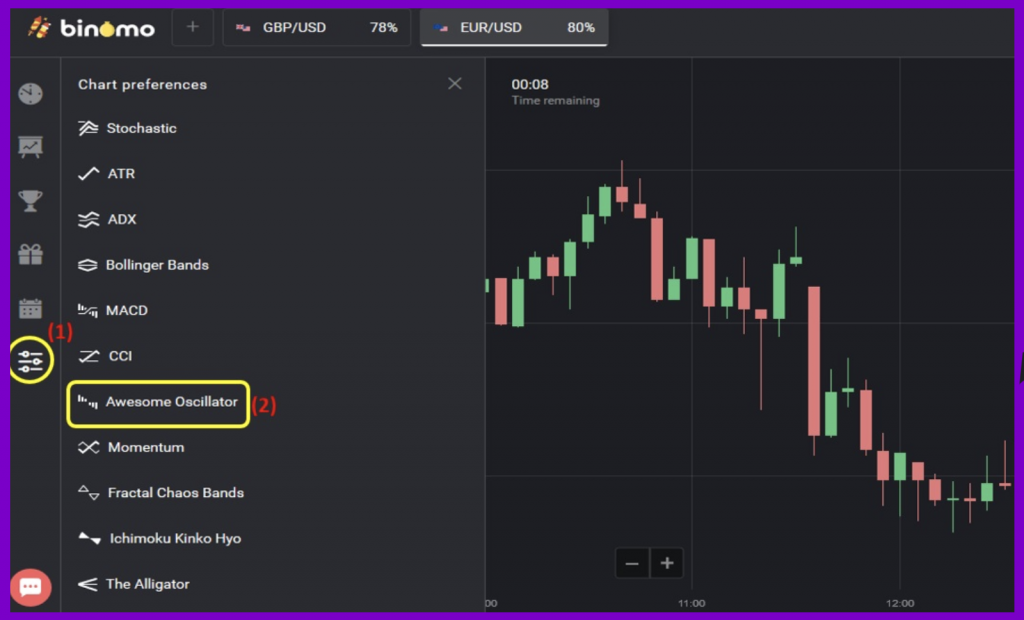
To set up the AO in Binomo, you neen to do as follows:
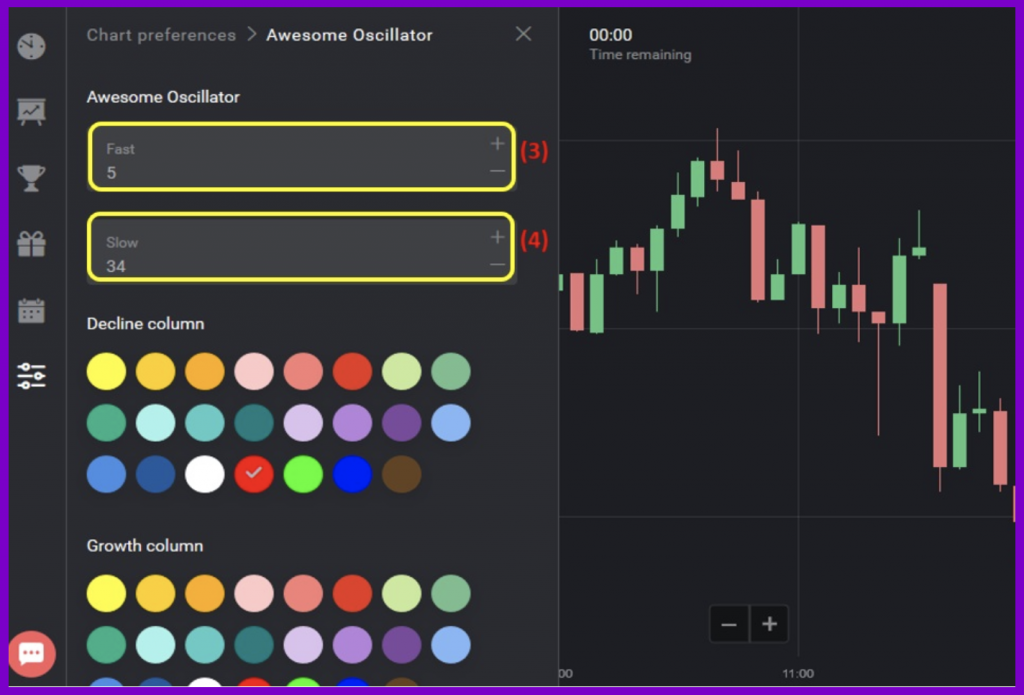
(1) Indicators => (2) Awesome Oscillator => (3) Choose the difference (usually set as default) => (4) Choose colors for the bars => Apply.
Trading Strategies Using The Awesome Oscillator Formula
In this section, I will show you how to trade with this indicator.
Formula: Awesome Oscillator + resistance/support.
The use of the price bullish/bearish signal of the AO combined with the static zones of the price will give reliable transactions.
Requirements: The 5-minute Japanese candlestick chart and the Awesome Oscillator indicator. The expiration time is 15 minutes or more.
- UP deals = the AO crosses the Zero line from below + the price enters the support zone and then bounces back.
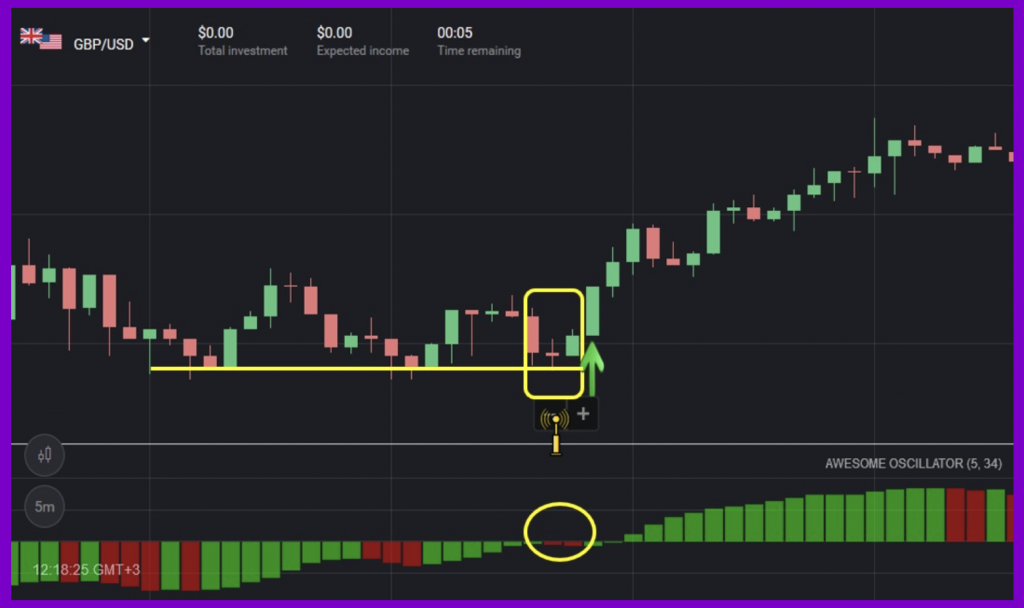
- DOWN deals = the AO crosses the Zero line from above + the price enters the resistance zone and then bounces back.
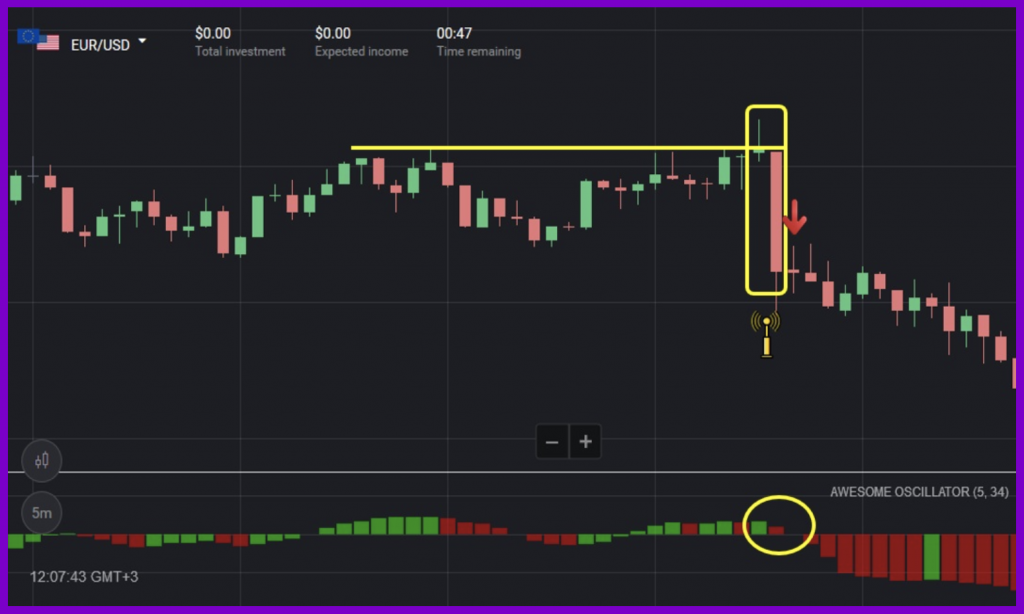
Summary of Awesome Oscillator
Awesome Oscillator indicator is simple and easy to understand for traders. In the following articles, there will be more advanced trading strategies using this indicator. Please don’t forget to leave us any comments or queries.