
In this article we will tell you about a simple indicator. This is Momentum indicator, it brings is very helpful for traders with price action styles.
The Momentum Indicator
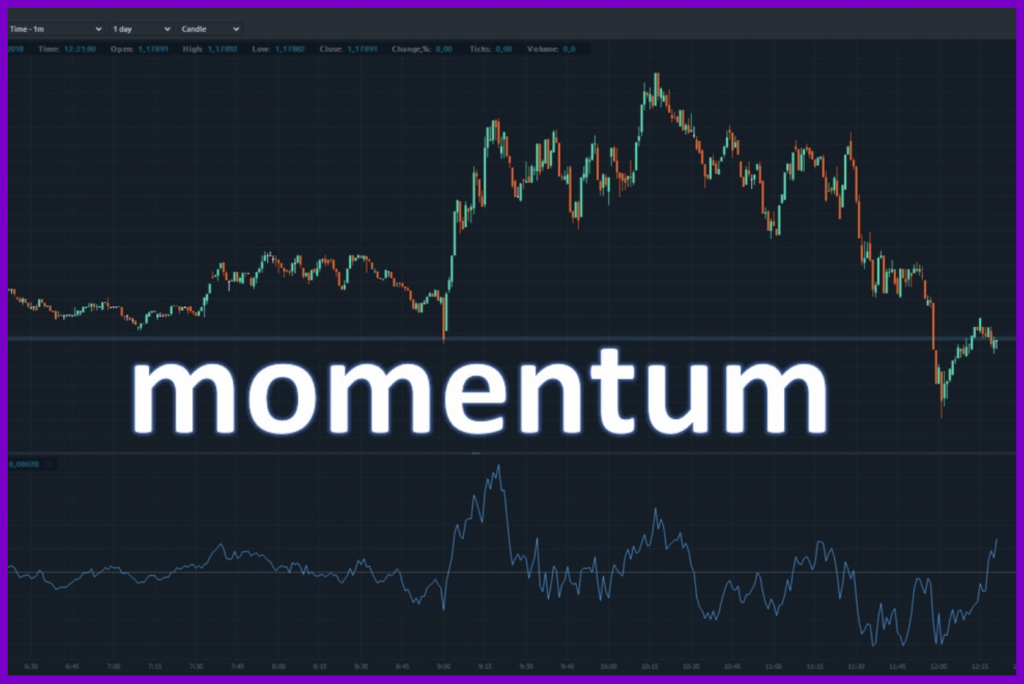
Technical indicator that measures changes in the price of a financial instrument in a specified period of time is called the Momentum indicator. It estimates the speed of price movements by comparing current and past values. The signals that Momentum can help you understand how prices will fluctuate over time and find a solid basis for your transactions.
The Signals That Momentum Gives Trend Reversal Signal
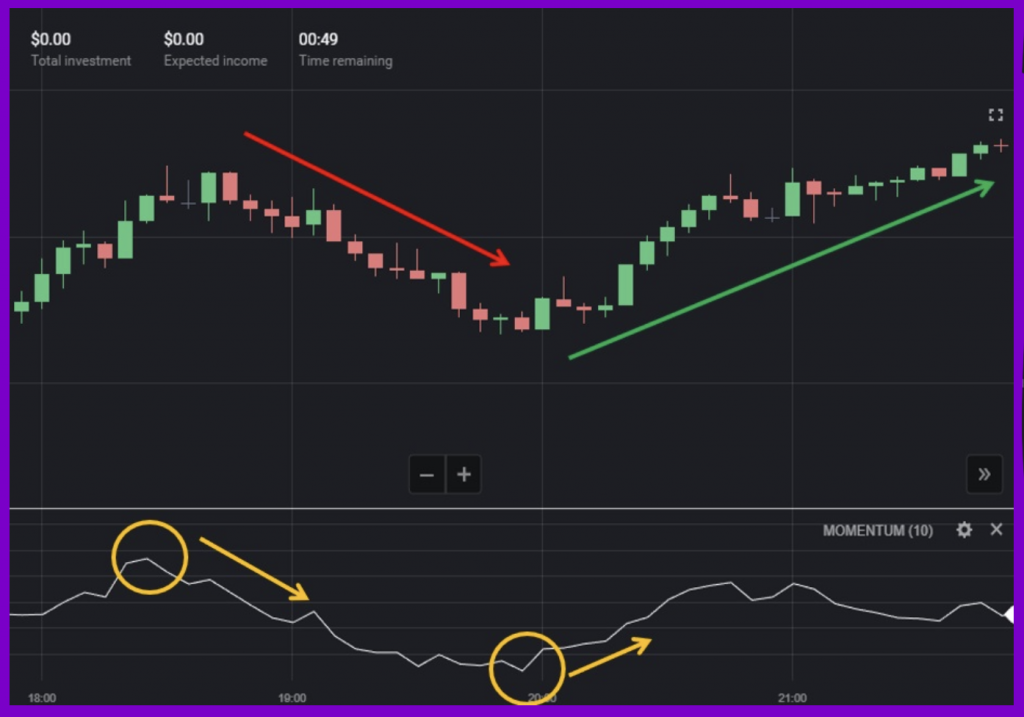
When price touches the end of a trend, momentum creates a peak and then changes direction. This creates a signal that indicates that the price trend will reverse in the future.
Trend Continuation Signal
This is a signal that requires careful observation before you can recognize it.
For example,
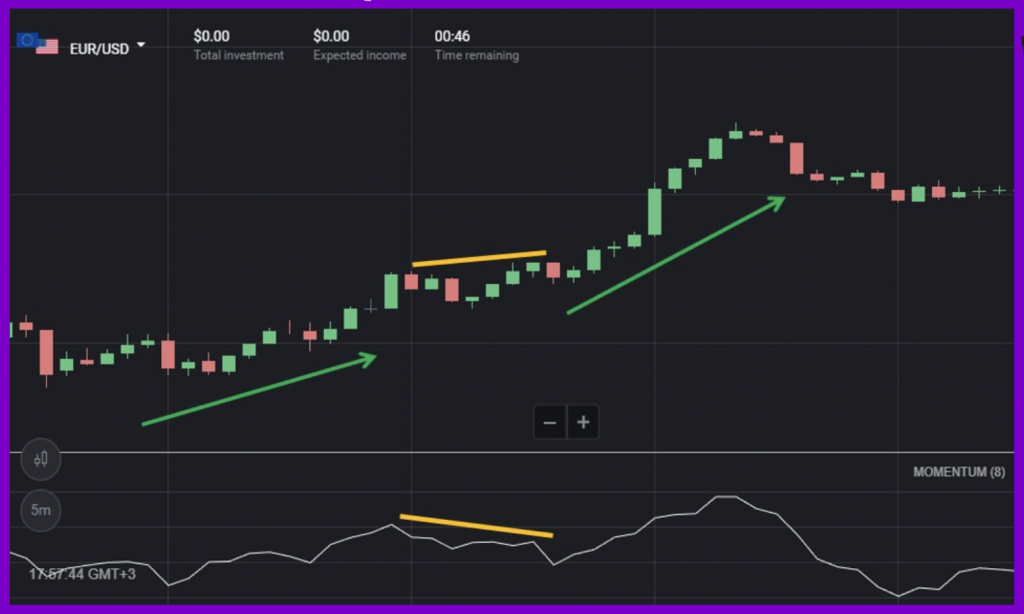
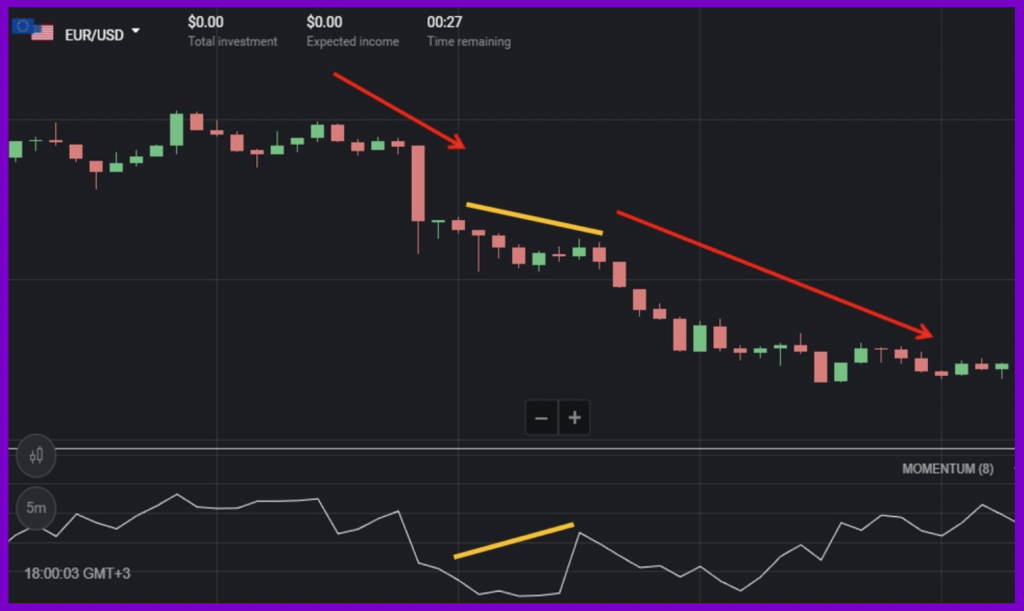
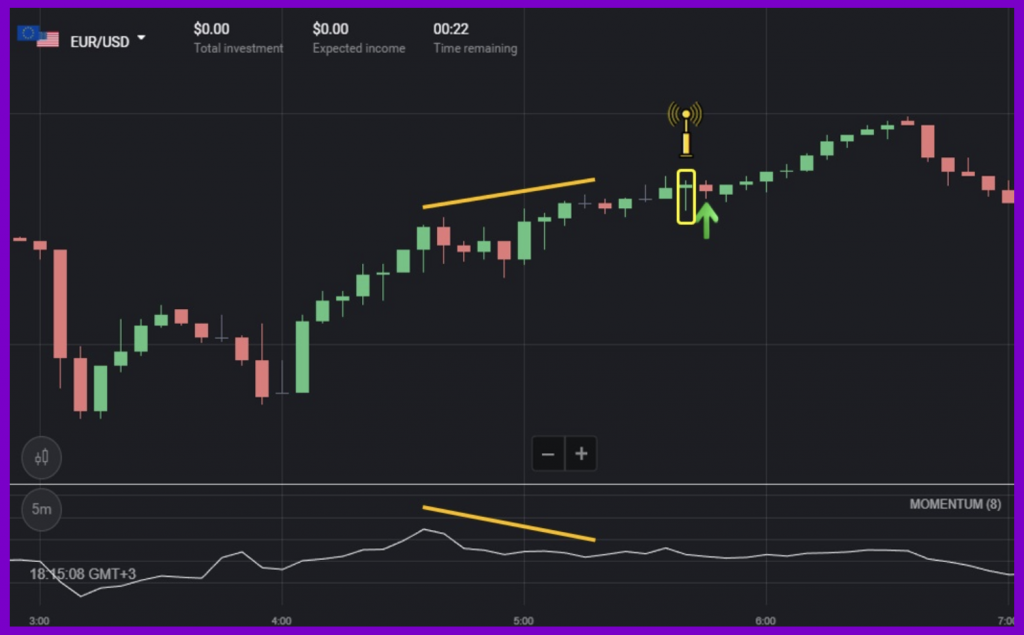
There is phenomenon which called the divergence between price and indicator. After this period, prices will almost continue to rise in the future. It means when the price continues its uptrend when the price goes up or sideways but the Momentum shows signs of a bearish trend.
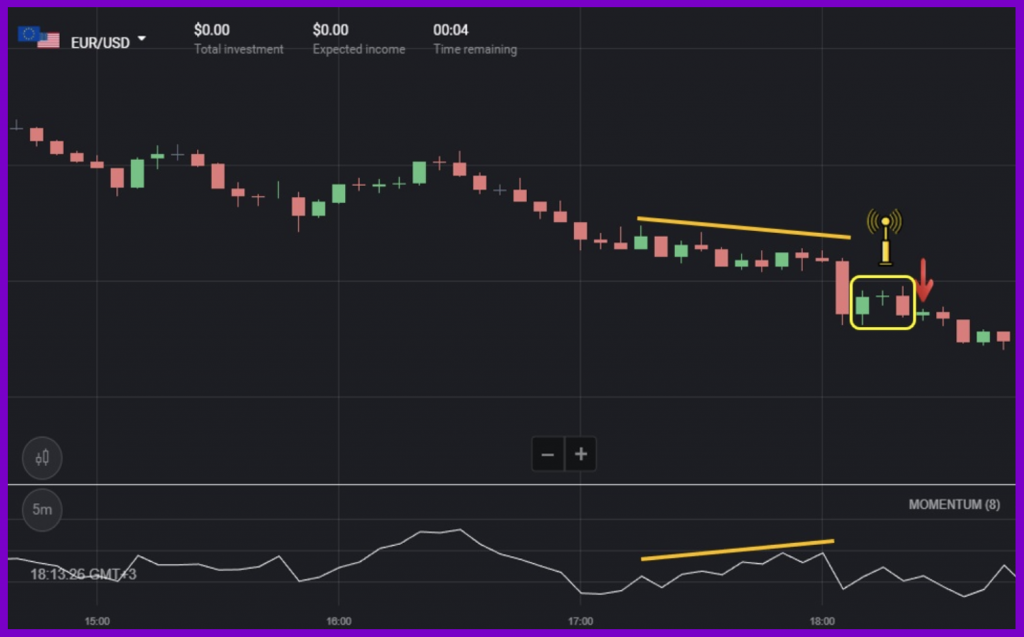
Where the price is in a downtrend (the price is falling or moving sideways) but Momentum is on a bullish trend.
How To Set Up Momentum Indicator In Binomo
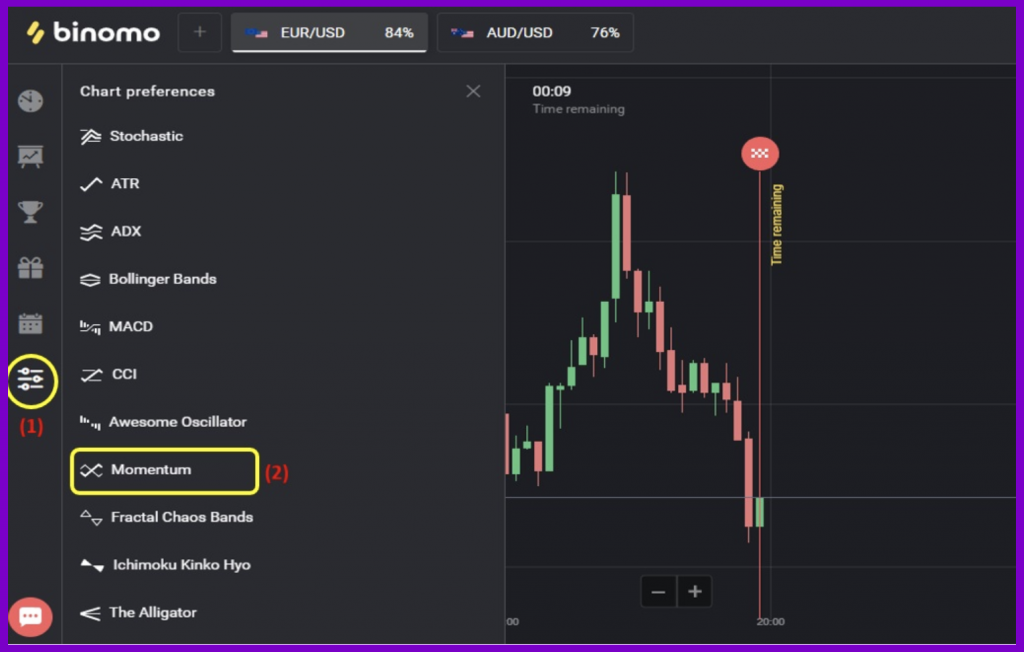
Choose the Indicators menu.
Select the Momentum indicator.
Number of candles that Momentum calculated.
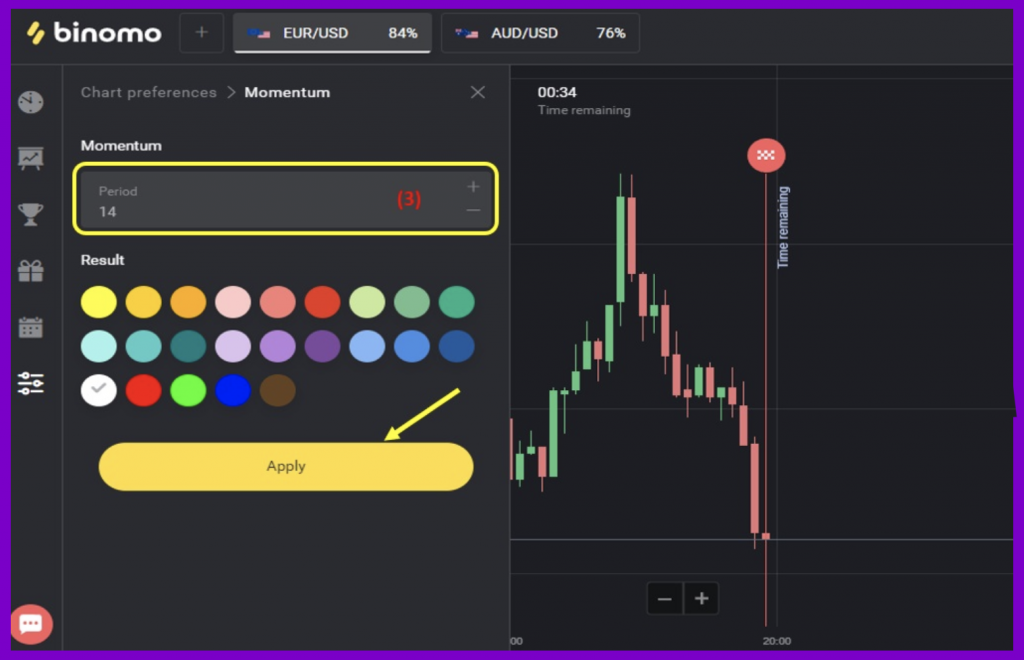
Then, set the color. Finally, click Apply to finish.
Trading Strategy Using The Momentum Indicator In Binomo
For effective trading strategies you can combine other indicators or signals based on the 2 signals that Momentum brings
Strategy 1: Trading Using Candlestick Colors
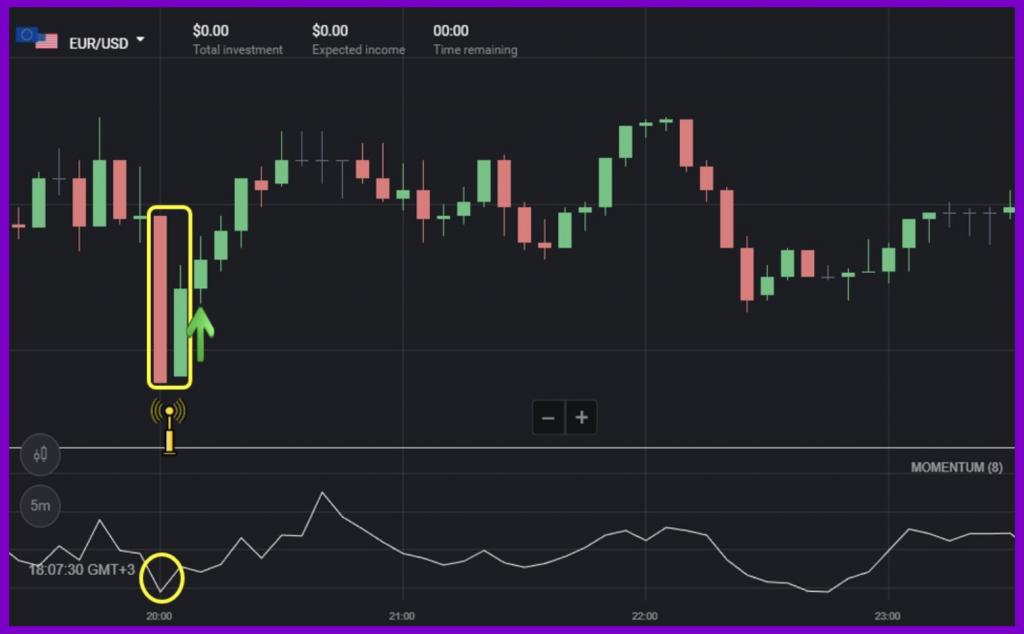
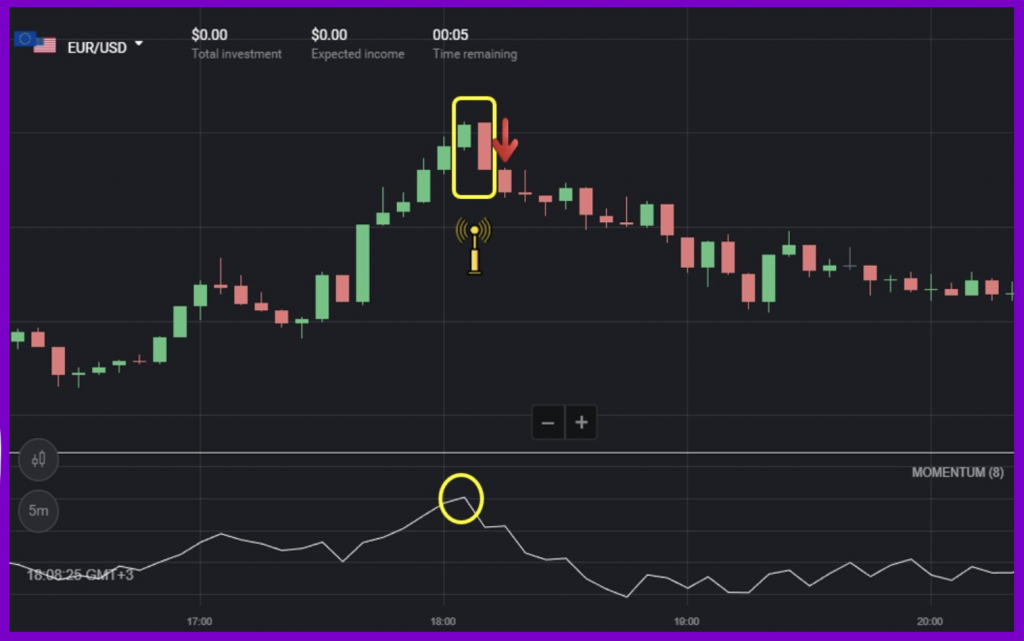
Entry signals will be the reversal candlestick patterns, confirming the trend reversal, which Momentum shows earlier.
Requirements: a 5-minute Japanese candlestick chart + Momentum indicator + opening deals as per the candlestick colors.
For example,
- UP deals = Momentum forms a trough and then goes up + bullish reversal candlestick pattern (Bullish Engulfing, Bullish Harami, etc.).
- DOWN deals = Momentum forms a peak and then goes down + bearish reversal candlestick pattern (Bearish Engulfing, Harami, etc).
Strategy 2: Long-Term Deals Combined With Reversal Candlestick Patterns
Long-term deals are the deals with the expiration time of 15 minutes or more. The entry basis is the divergence of the Momentum compared to the price. The reversal signal is a special candlestick pattern (Morning Star, Tweezer, Engulfing, etc.).
- Open UP deals = bullish Momentum divergence + bullish reversal candlestick pattern (Bullish Harami, Pin Bar, Morning Star, etc.).
- Open DOWN deals = bearish Momentum divergence + bearish reversal candlestick pattern (Bearish Harami, Pin Bar, Evening Star, etc.).
In this article you got acquainted with a simple indicator. Create for yourself a demo account to be able to get used to the Momentum indicator today. Good luck. Do not forget to leave any of your questions as well as comments here.