Today we will tell you about the Commodity Channel Index (CCI).
These are oversold and overbought zones of the market, which are good signals for
trading.
Let’s see how it is used in trading.
CCI Indicator
An indicator used in technical analysis of financial markets it is called The Commodity Channel Index (CCI). It belongs to the group of oscillating technical indicators. The CCI indicator oscillates between fixed levels from +100 to -100. When the indicator rises above +100 or drops below -100, it signals overbought and oversold conditions.
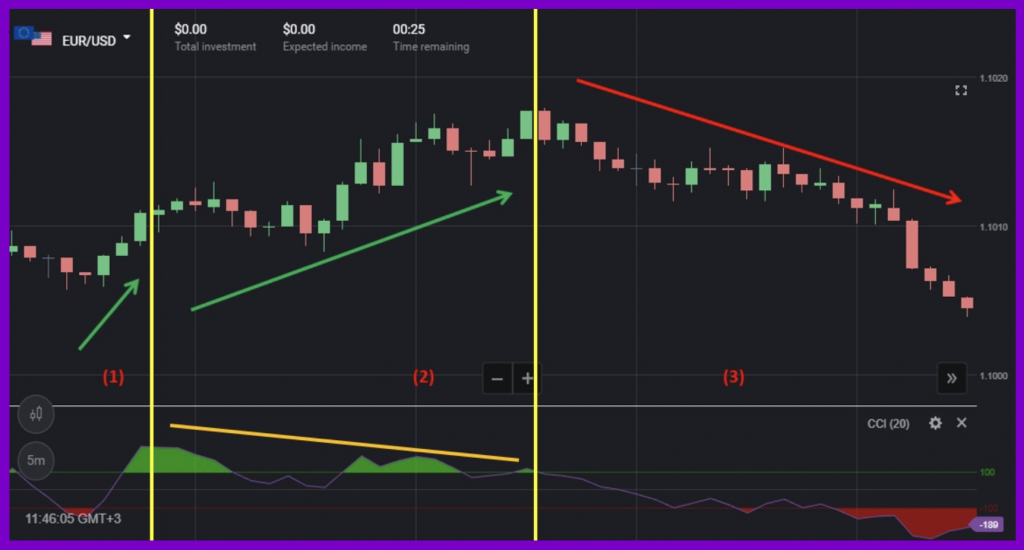
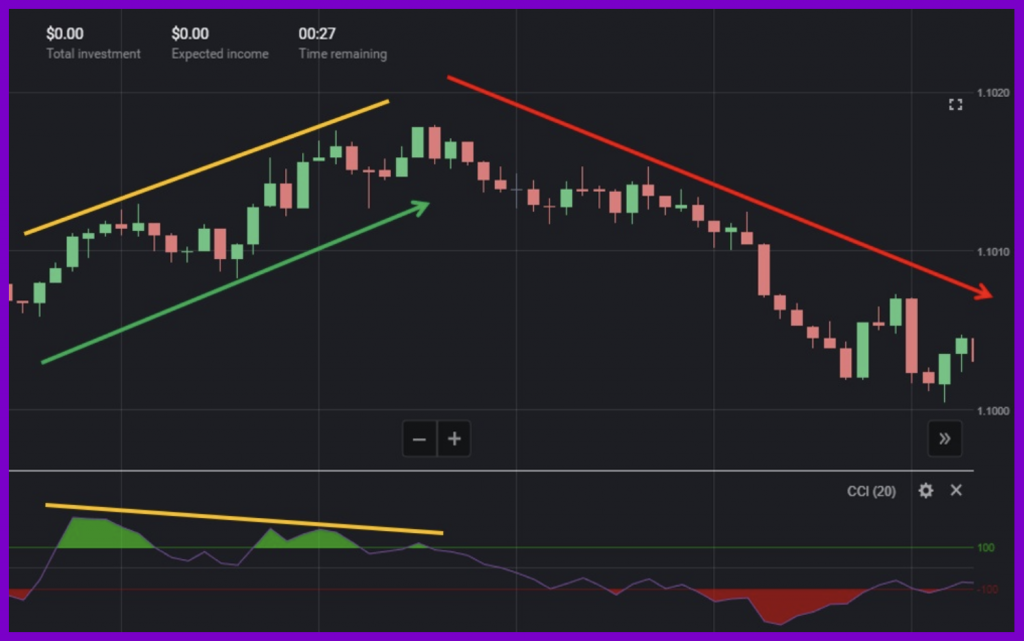
As we can see in the picture above.
Zone (1): As the price is in an uptrend, the CCI shifts from oversold to overbought zones.
Zone (2): The price is in an uptrend, however, the CCI is in a bearish trend. This is also called CCI divergence.
Zone (3): The price is in a downtrend. The CCI goes from overbought to oversold zones.
How Does CCI Indicator Work?
Use To Identify Trends
When the CCI indicator rises above the overbought zone, the momentum renews. When the indicator starts falling below the overbought zone, the trend will resume. It shows that the bearish trend is getting stronger. The same is true for the bullish trend.
CCI Divergence
A very good signal for you to use in trading is when CCI is
divergent.
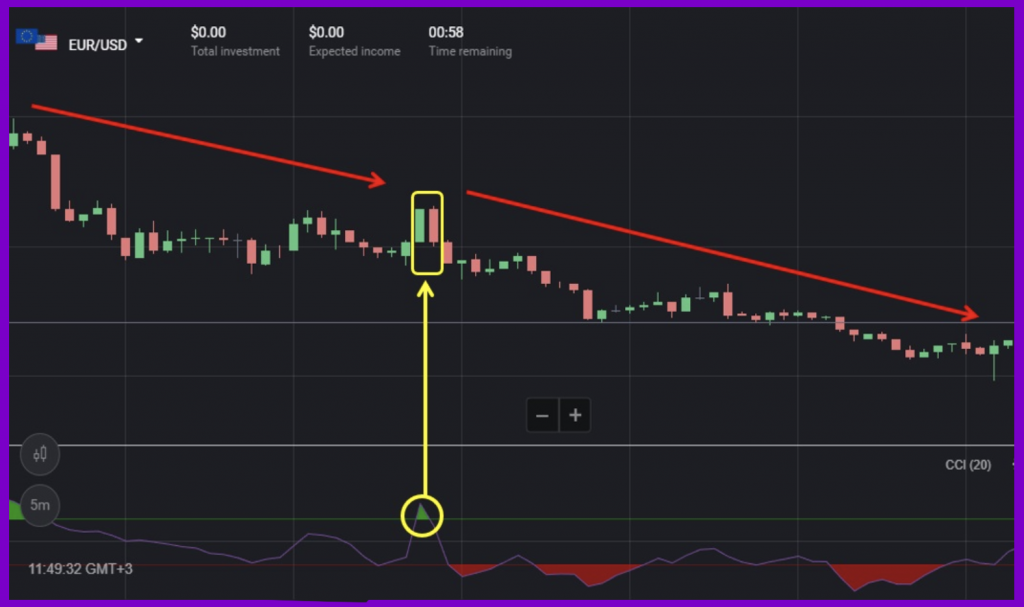
CCI divergence is the when the price increases but the CCI momentum indicator goes
down or the price decreases but the CCI goes up.
For example, as shown in the picture below:
the price increases however the CCI is in a bearish trend. After this signal ended, the price
reversed in a bearish direction.
Trading Strategy Using CCI Indicator
CCI is a market momentum indicator. It gives accurate signals in the medium and long-term. So you also need short-term signals for a perfect strategy. Check out some of the strategies right below.
Requirements: 5-minute Japanese candlestick chart. Enter trade with the expiration time of 10 minutes or above.
Strategy 1: CCI Divergence Combined With Reversal Candlestick Patterns
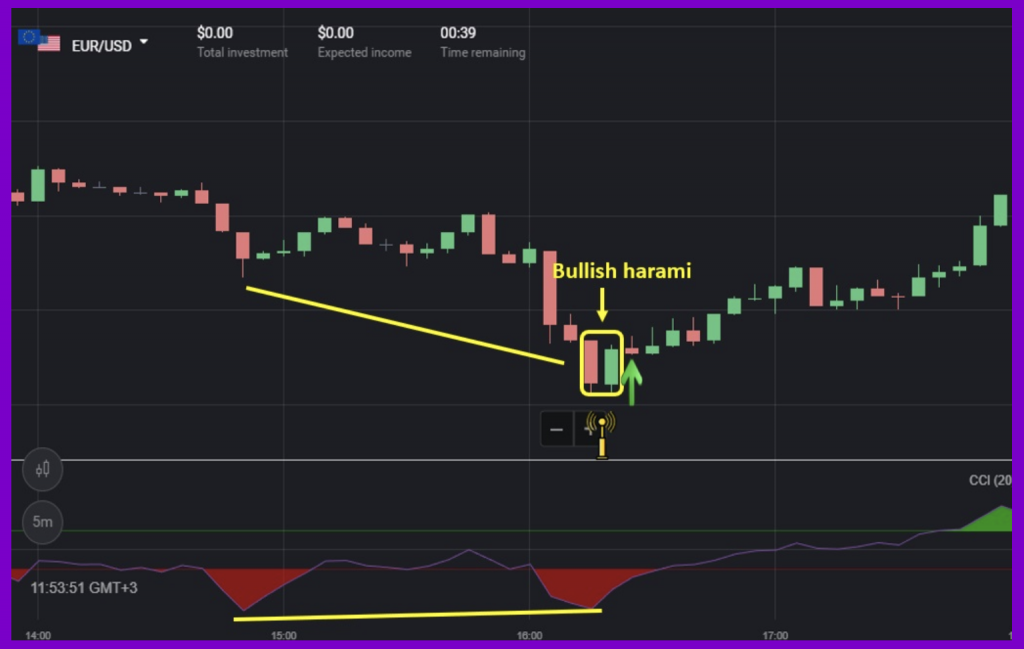
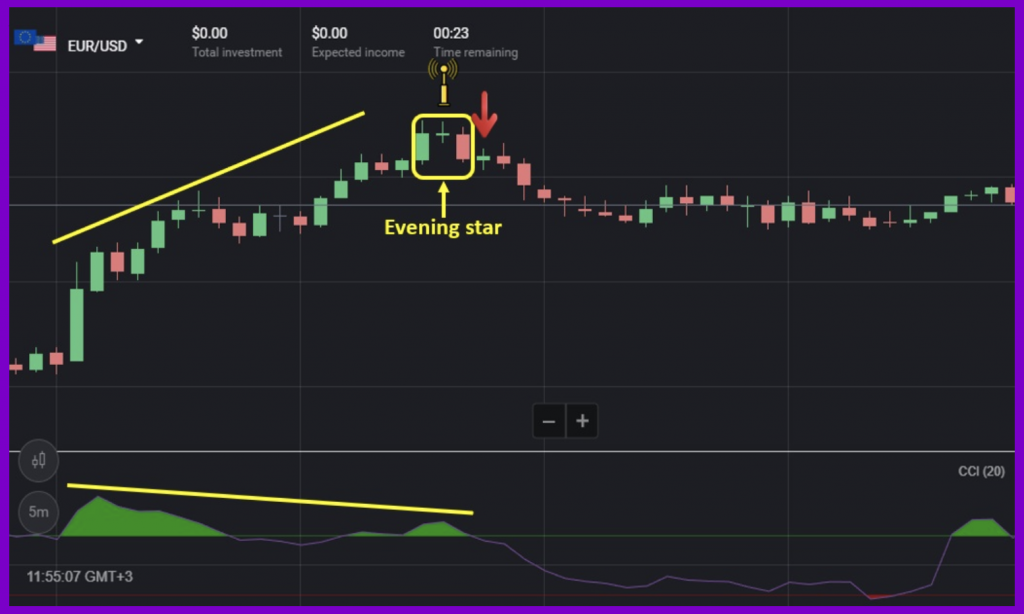
In this strategy, you need to observe 2 signals. The first one is the CCI divergence. The second is that this divergence ends with a reversal candlestick pattern. Details as follows:
Open UP deals = bullish reversal CCI divergence + Bullish Harami.
Open DOWN deals = bearish reversal CCI divergence + Evening Star candlestick pattern.
Strategy 2: CCI Combined With Bollinger Bands
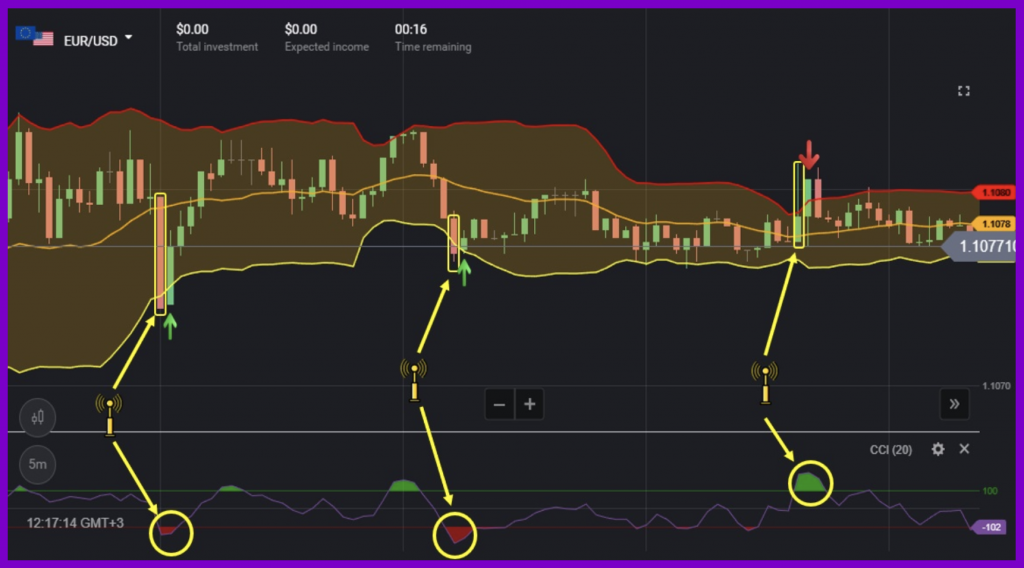
Bollinger Bands is a good reversal signal of prices in the short-term. When combined with CCI, the accuracy of trading becomes very high.
Open UP deal = the price drops below the lower band of the Bollinger Bands + CCI is in the oversold zone.
Open DOWN deal = the price goes above the upper band of the Bollinger Bands + CCI is in the overbought zone.
In Conclusion
The CCI – a good indicator for market technical analysis. Follow us for more trading strategies with this indicator. Also, you can experience this indicator directly on a demo account.