In this article, we will show you an accurate and reliable indicator that Japanese traders use. Ichimoku is a pretty picky indicator because it is a system of many small indicators in which the shape is quite difficult to see.
This indicator is a balanced graph through one look. It means that everything, when viewed through Ichimoku indicator is harmonious, balanced, and full. With this indicator, trading is more reliable, because it provides price levels and price trends, short, medium and long-term price movements.
The Structure Of Ichimoku Indicator
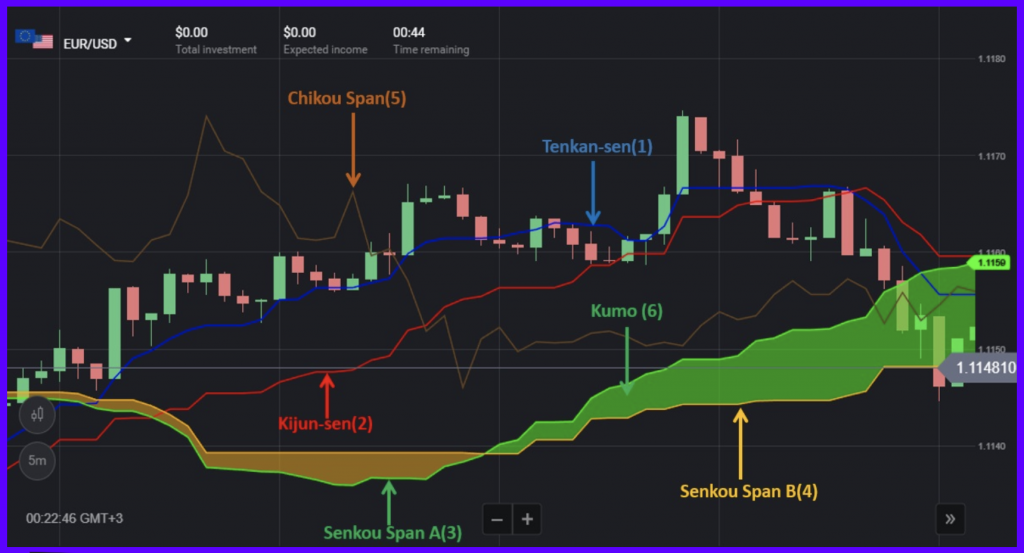
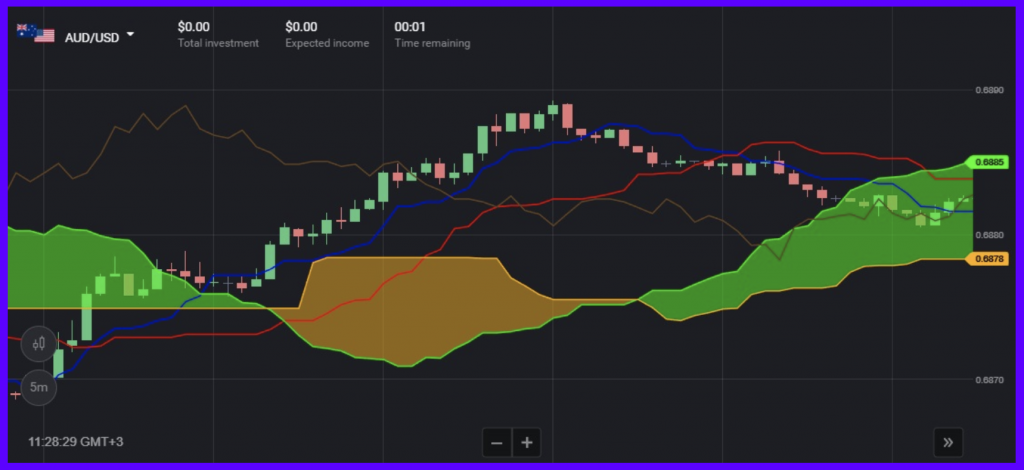
This is an indicator formed of 5 lines:
- Tenkan-sen line (blue line) or conversion line. Adding the highest high and the highest low for the last nine periods, and dividing the result by two.
- Kijun-sen Street (red line) or base line. Adding the highest high and the lowest low for the last 26 periods and dividing the result by two.
- Senkou Span A (green line). Adding the Tenkan-sen and the Kijun-sen and dividing the result by two. This line is considered a leading span because it is ahead of the price of 26 candles.
- Senkou Span B (orange line). Adding the highest high and the lowest low over the past 52 periods and dividing the result by two. This line is also considered a leading span because it is ahead of the price of 26 candles.
- Chikou Span (brown line): lagging span. It is the the closing price of the current periodplotted 26 periods back on the chart.
- Senkou Span A and Senkou Span B combine to form the Kumo cloud, plotting the price 26 periods ahead. This is considered a support or resistance zone of the price in trading.
Basic Signals Of The Ichimoku Indicator
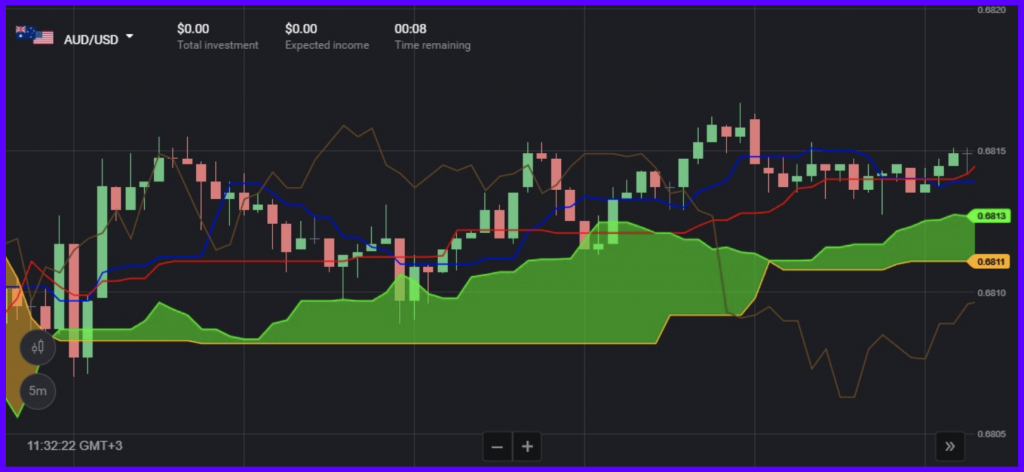
The trend: the price tends to go in a fixed direction if two conversion(Tenkan-sen) and base lines lines (Kijun-sen) intersect and expand..
a. The conversion line intersects the base line from the top down. The price is in a downtrend.
b. The conversion line intersects the base line from the bottom up. The price is in an uptrend.
Reversal price signal: When the price goes above or below all these indicator lines, the price goes to the reversal and intersection of these lines.
If you use these basic signals of Ichimoku in Binomo, you will be able to build reliable trading strategies.
Trading Strategies Using The Ichimoku Indicator
Candlestick Colors Combined With Reversal Signals Of Candlestick Patterns
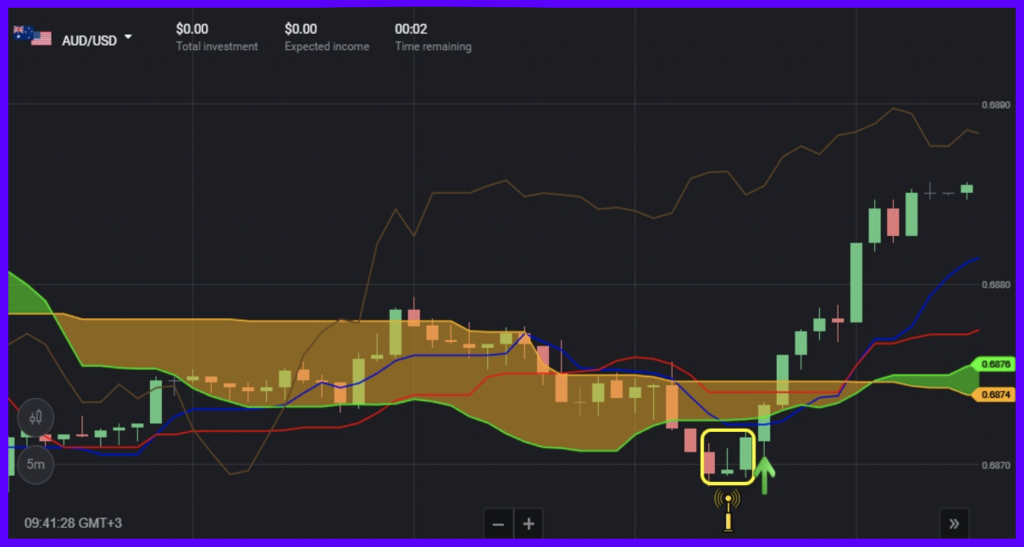
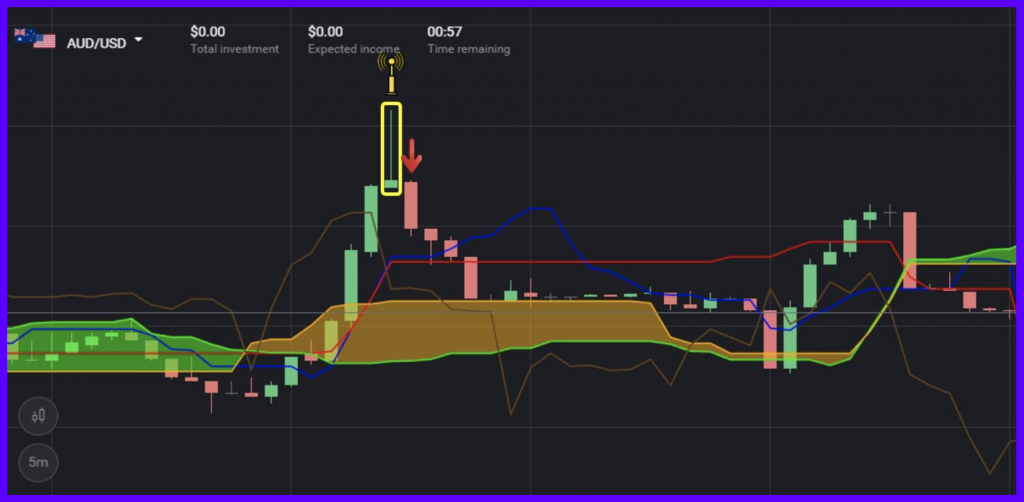
Explanation: It is important to focus on observing when using the Ichimoku reversal signal when the price crosses over (or drops below) all the lines of the indicator. The entry signal will be the reversal candlestick patterns (Hammer, Shooting Star, Evening Star, Harami, etc.)
Requirements: A 5-minute candlestick chart, opening deals according to the color of the candle. The expiration time is equal to the period of 1 candlestick (5 minutes).
For example,
Open UP deals = the price is in a downtrend and drops below all Ichimoku lines + bullish reversal candlestick pattern (Morning Star, Hammer, Bullish Harami, etc.).
Open DOWN deals = the price goes up over all Ichimoku lines + bearish reversal candlestick pattern (Shooting Star, Bearish Engulfing, etc.).
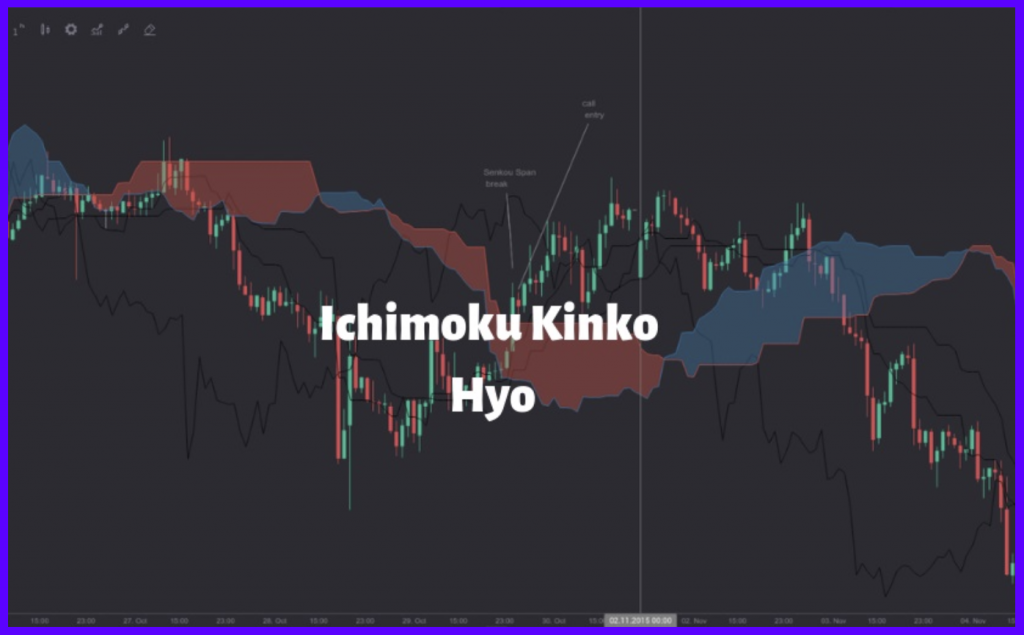
Opening Long-Term Deals Using Only Ichimoku Kinko Hyo
As mentioned above, with the Ichimoku indicator, it is better focus on observing.
Requirements: A 5-minute candlestick chart, the expiration time of 15 minutes or above.
For example,
UP deals = the price is above the Komu cloud + the price tests the levels by dropping below the base line (the red line) but then crossing over the conversion line (the blue line).
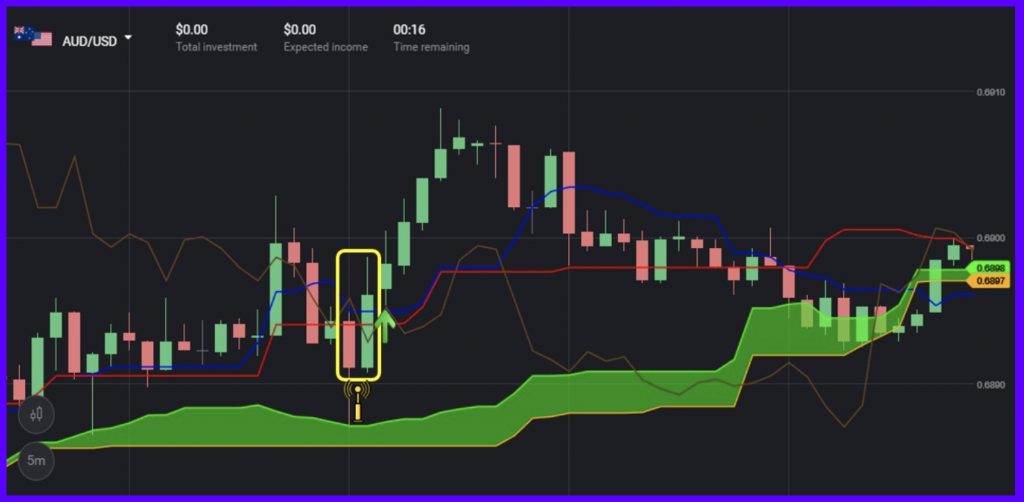
DOWN deals = the price is below the Komu cloud + the price tests the levels by crossing over the base line (the red line) but then dropping below the conversion line (the blue line).
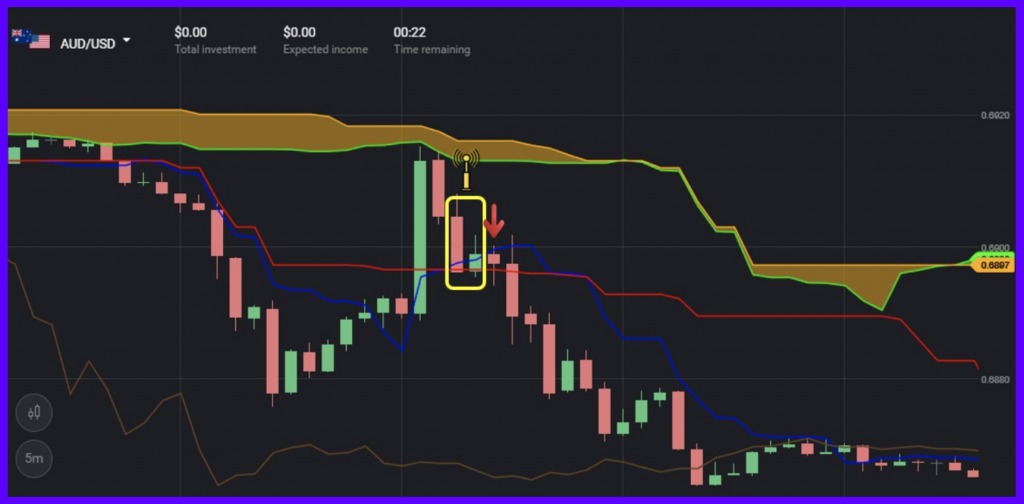
How To Set Up In Binomo
To understand how to set up the Ichimoku indicator in Binomo, you need to do as follows:
- Choose the Indicators menu.
- Scroll down to select the Ichimoku Kinko Hyo indicator.
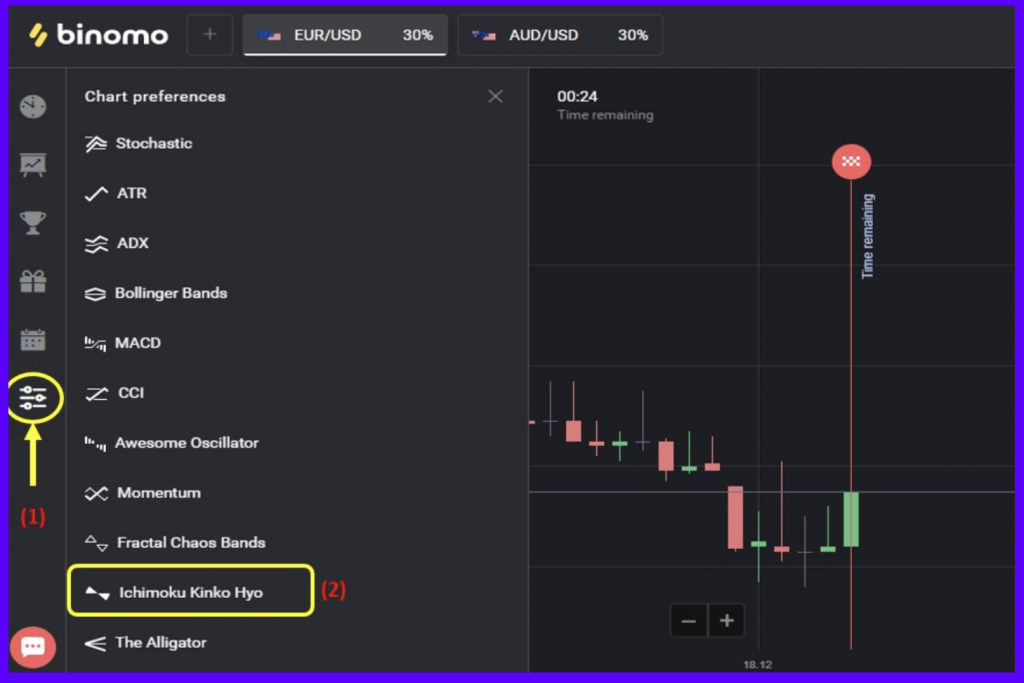
An Ichimoku setup window appears. You do not need to reset the parameters. The default parameters will be as follows:
- The base line: 26
- The conversion line:9
- The lagging span:26
- The leading span B: 52
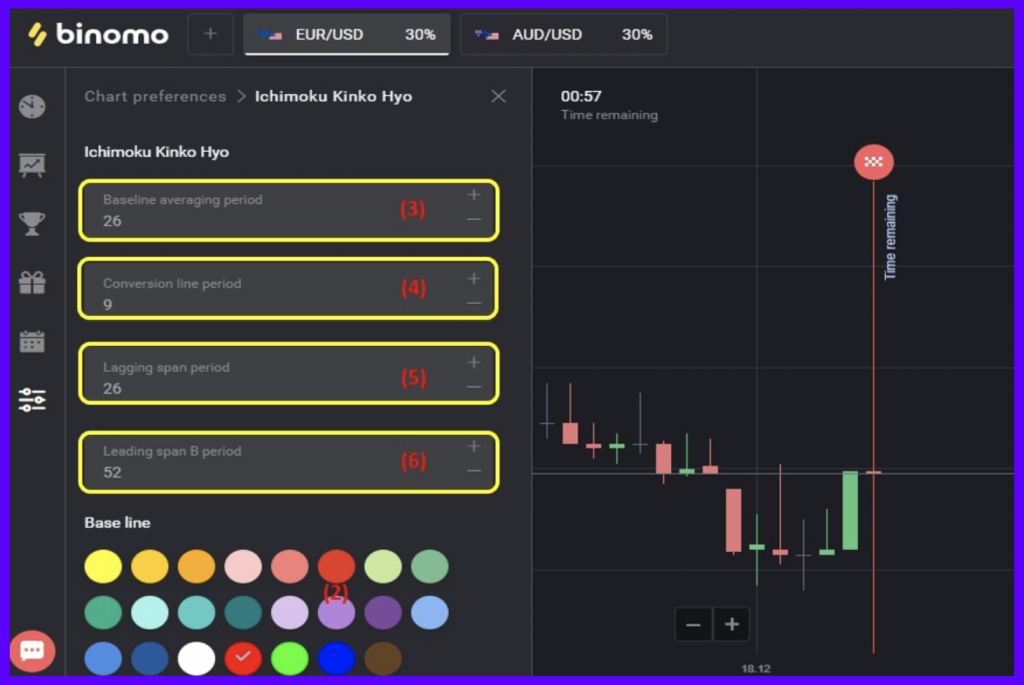
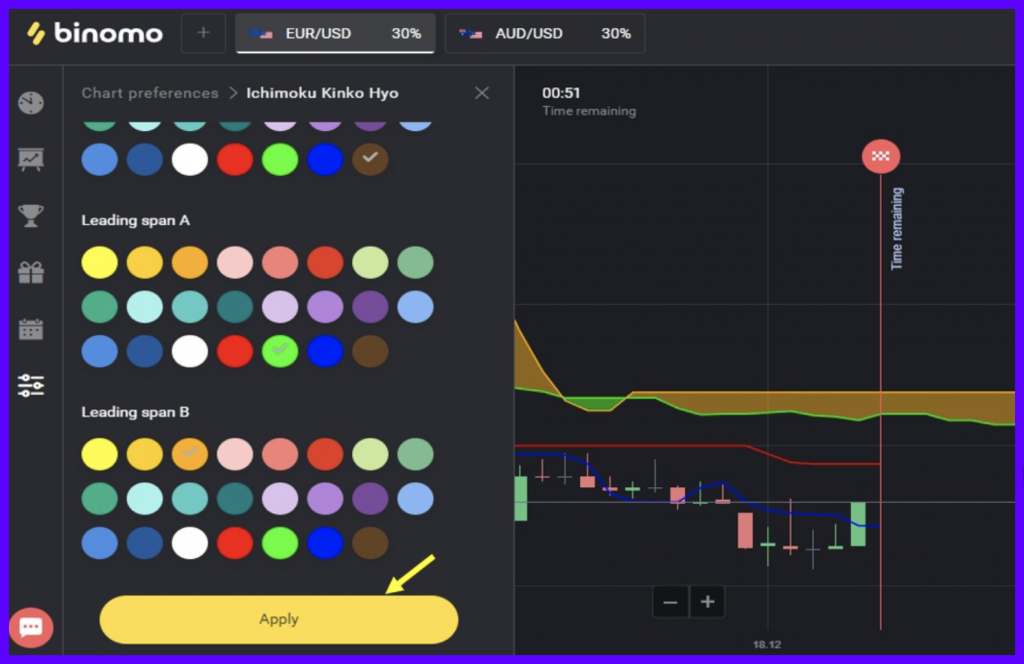
Next is the custom settings for each line, you can choose your favorite color. Then, click Apply to finish.
Conclusion
Practice Ichimoku today on a demo account to understand the benefits it brings in trading. Leave any of your questions as well as comments here.